Instant download
after payment (24/7)
 Wide range of formats
(for all gadgets)
 Full book
(including for Apple and Android)
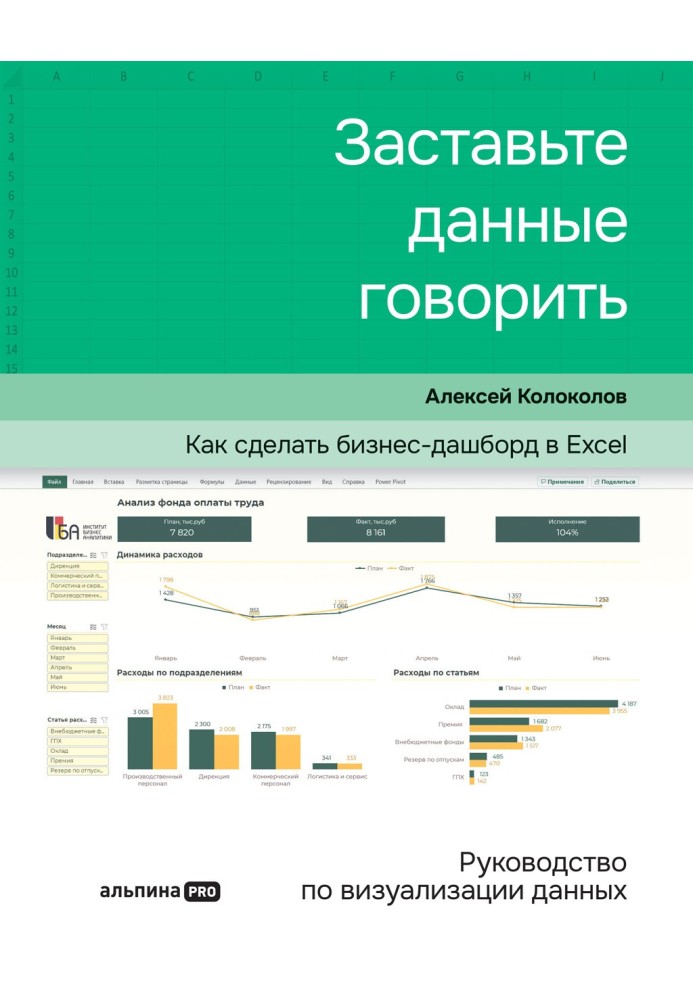
Collecting scattered data for a report and presenting it visually is not the easiest task for the customer. Alexey Kolokolov, who has been teaching data analysis and visualization since 2015, knows this well. He wrote a detailed guide to creating dashboards and devoted much of it to practice. Kolokolov consistently analyzes the process of drawing up a report, starting with data preparation and ending with design in a corporate style. Using real examples, he describes what needs to be done at each stage, and accompanies the story with detailed illustrations. The reader will be able to build a functional dashboard from scratch, even without Excel skills. I want your reports to be clear and useful. So that the data in them speaks the language of business and helps managers draw conclusions in a timely manner. To do this, it is important to be able to turn data into information. That's why I wrote this book. Alexey Kolokolov explains how to pre-work with the data so that the dashboard is updated automatically, how to arrange information blocks on the layout and design the elements so that the report looks professional and expensive. The reader will learn which charts are best to use for different types of data, understand the principles of setting them up and become familiar with visualization techniques that can be used in Excel, PowerPoint, Power BI, Tableau or Russian BI systems.
Features• A visual cheat sheet that will help you build a dashboard in Excel or any BI system;• First practice, then theory;• The book can be read or watched - many chapters are available in video tutorial format on YouTube.
For whomFor business -analysts, executives, managers and everyone who has to prepare reports.
Книга "Примусьте говорити дані" від Олексія Колоколова - це справжній скарб для бізнес-аналітиків, менеджерів і всіх, хто прагне навчитися візуалізувати дані в Excel. Автор детально розкриває процес створення дашбордів, починаючи з підготовки даних і закінчуючи оформленням звіту у фірмовому стилі. Я особливо ціную практичний підхід, адже книга містить безліч реальних прикладів та ілюстрацій, що роблять навчання легким і зрозумілим. Завдяки цьому посібнику я зміг створити функціональний дашборд з нуля, навіть не маючи попереднього досвіду роботи в Excel. Олексій також ділиться корисними порадами щодо вибору діаграм та елементів дизайну, що дозволяє створити професійний вигляд звіту. Відеоуроки на YouTube – це додаткова перевага, яка робить навчання ще більш інтерактивним. Рекомендую цю книгу всім, хто хоче, щоб їхні звіти були зрозумілими і корисними для прийняття рішень у бізнесі!
Collecting scattered data for a report and presenting it visually is not the easiest task for the customer. Alexey Kolokolov, who has been teaching data anal...